IV. Rally Hungary Data analytics
hauserresults data analytics data visualization
Introduction
We (the HauserResults team) are responsible for National Championship rally events since 2002.
From 2016 we are doing all of the National Events and also responsible for the FIA European Rally Championship events in Hungary.
Our job is to provide the results of the events, keep track of the competitors and the penalties they get during the events.
Since 2019 we also provide the live timing for the spectators and the media.
We also provide a fairly complex RaceControl system for the CoC organizers, which helps to ensure the safety of the races.
Breakdown of the project
1. Getting the data
Since we are long setteled in the industry, we have a lot of data from the past events. We have the results of the competitors, the penalties they got, the times they did on the stages, etc. These timing and GPS data are provided with our partners and stored in a database.
Just imagine what 20 years of data means. We have more than 23 000 competitors, more than 1 000 stages, more than 215 000 stage times, etc.
From 2017 and on we have GPS data for the competitors, so we can track their position on the stages with 1Hz sampling rate.
2. The power of data
We have a lot of data, but what can we do with it? We can analyze it and provide useful information for the competitors.
Alongside with the somewhat boring and obvious statistics and basic timing info, we can provide some more interesting information, like predicting the taken time.
From 20 years of data we can predict the taken time on a stage based on the competitors’ previous results. This is a very useful information for the competitors, because they can see if they are faster or slower than their previous results.
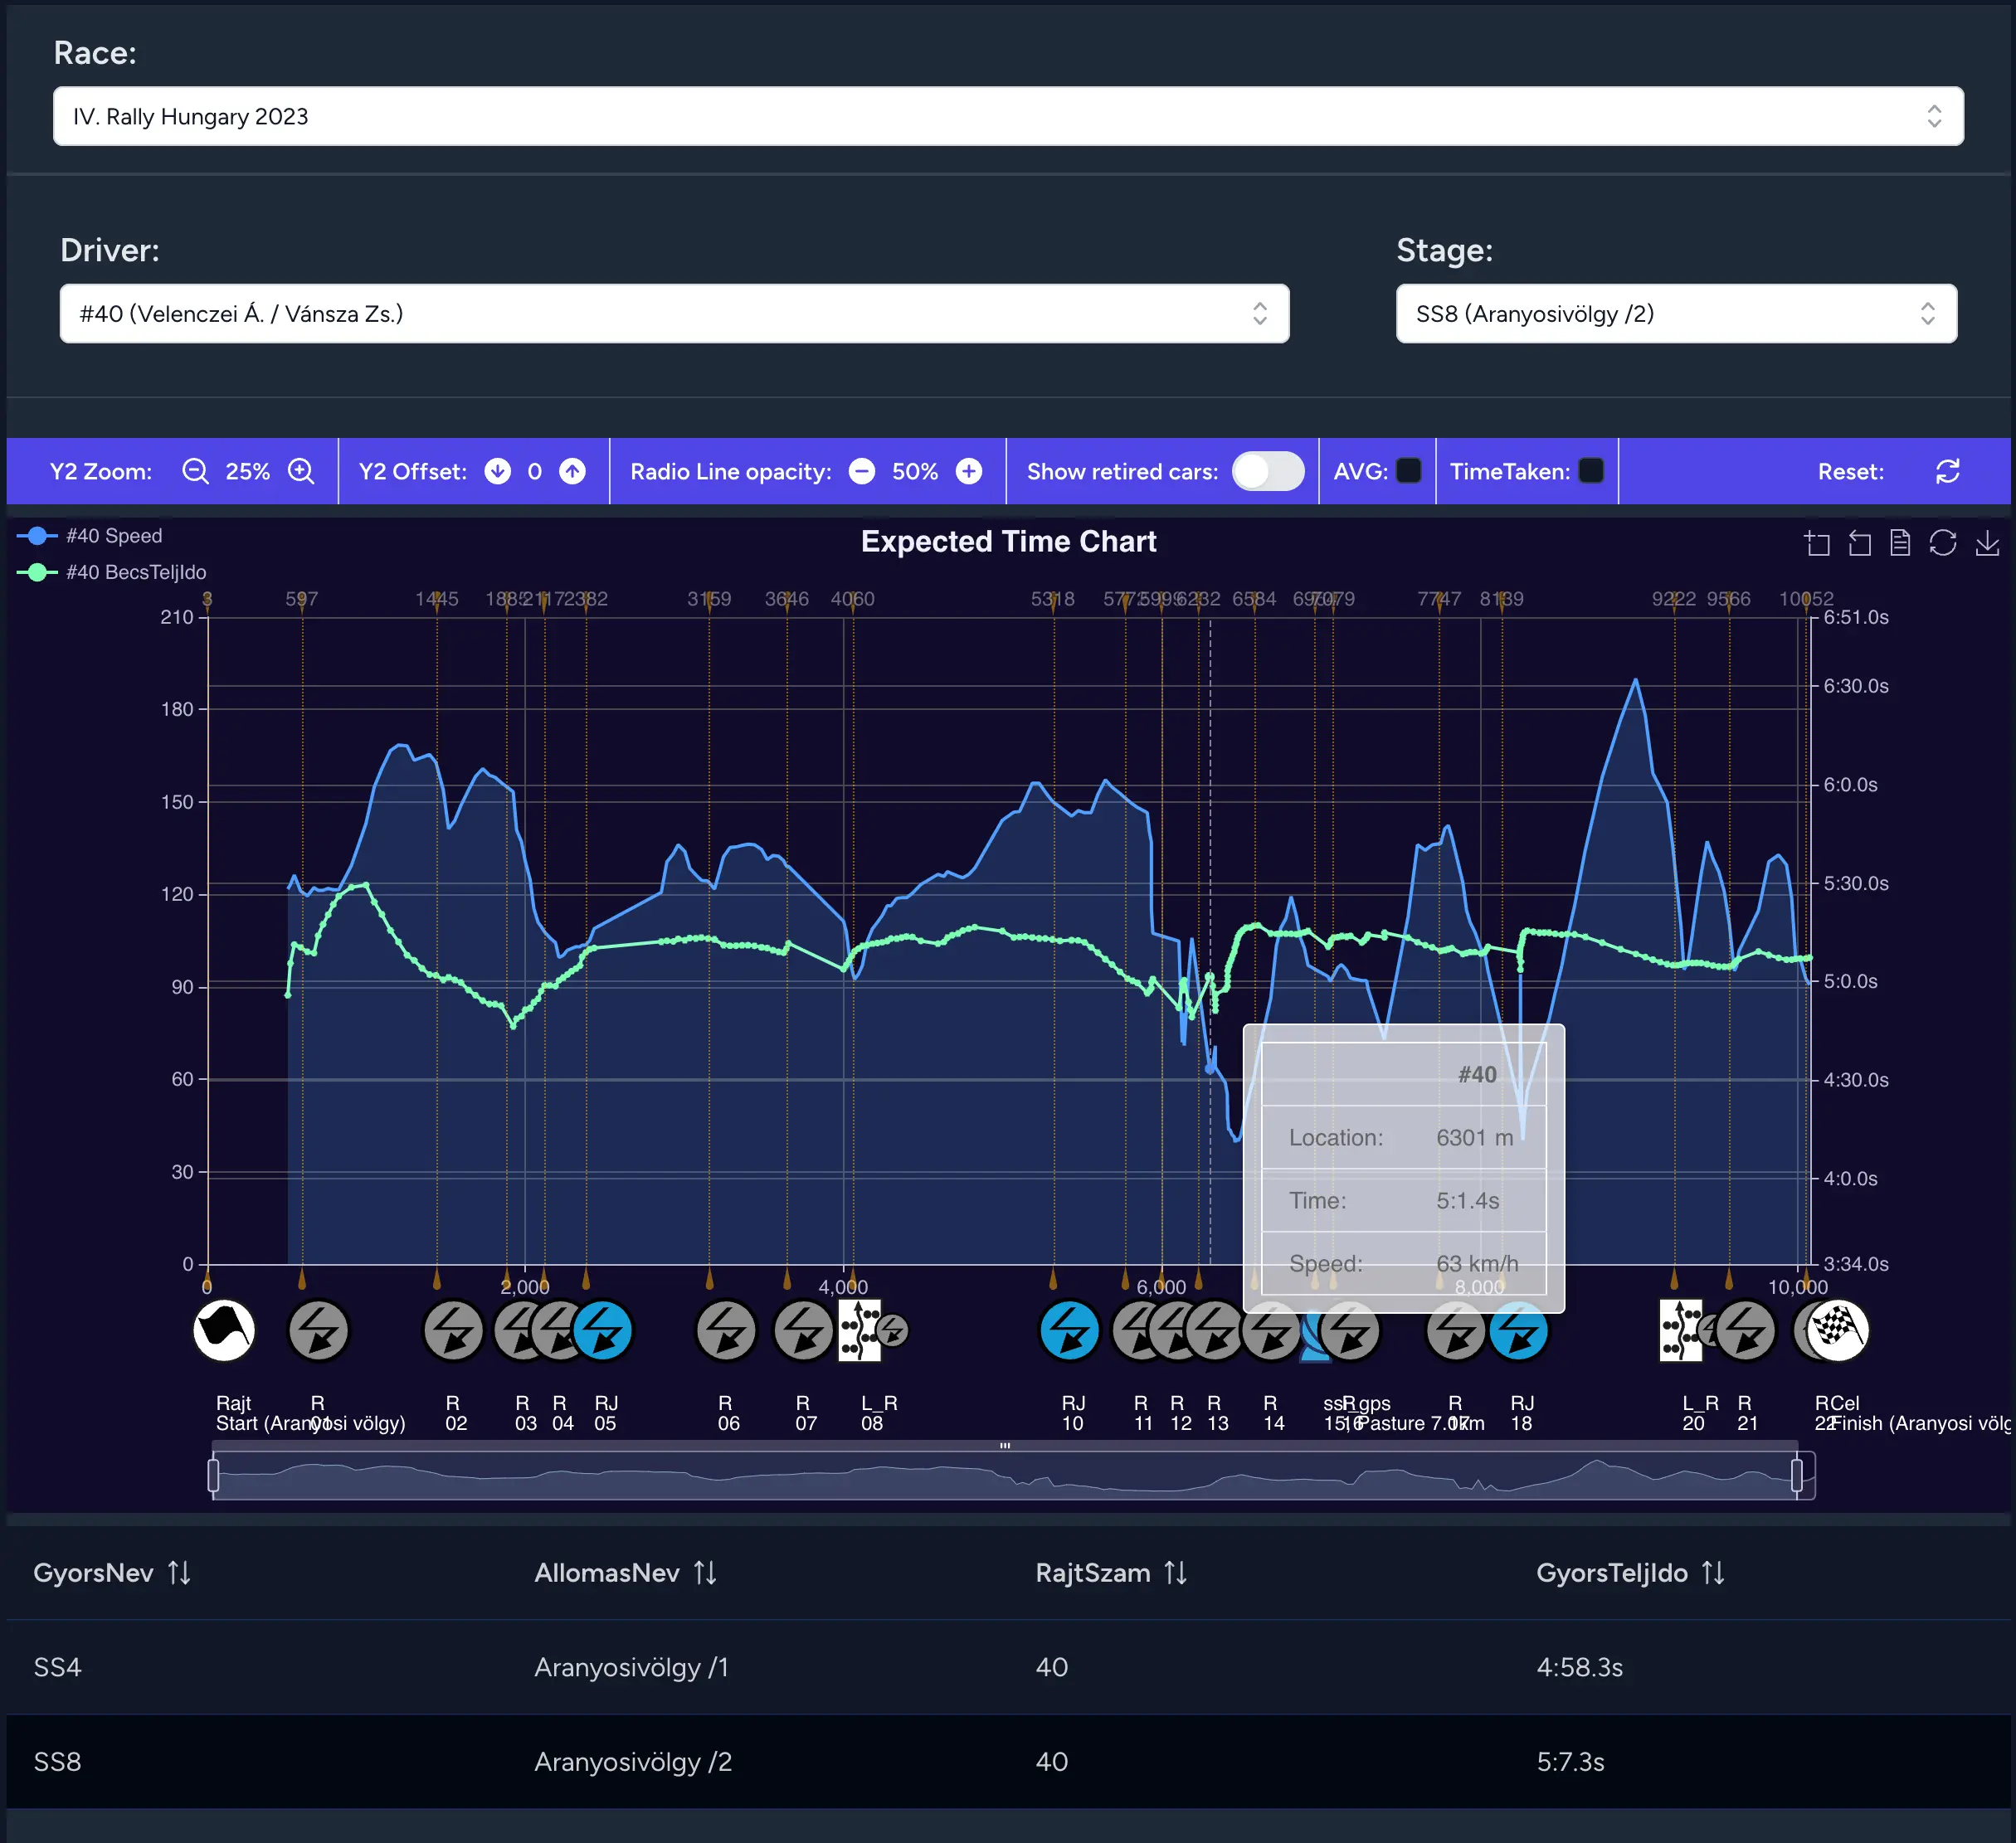 Also this information can be used by the CoC to give assesed time to a competitor if they got held up at an accident.
3. Visualization
We have a lot of data, but how can we show it to the competitors and fans? We have to visualize it in a comprehensible and simple format.
We have created a python script which can generate a lot of different graphs and charts from the data. We can generate graphs for the competitors, for the fans, for the media, etc. We can generate graphs for the whole event, for a single stage, for a single competitor. We even added an option that determines the closest battle between two competitors and generates a graph for that.
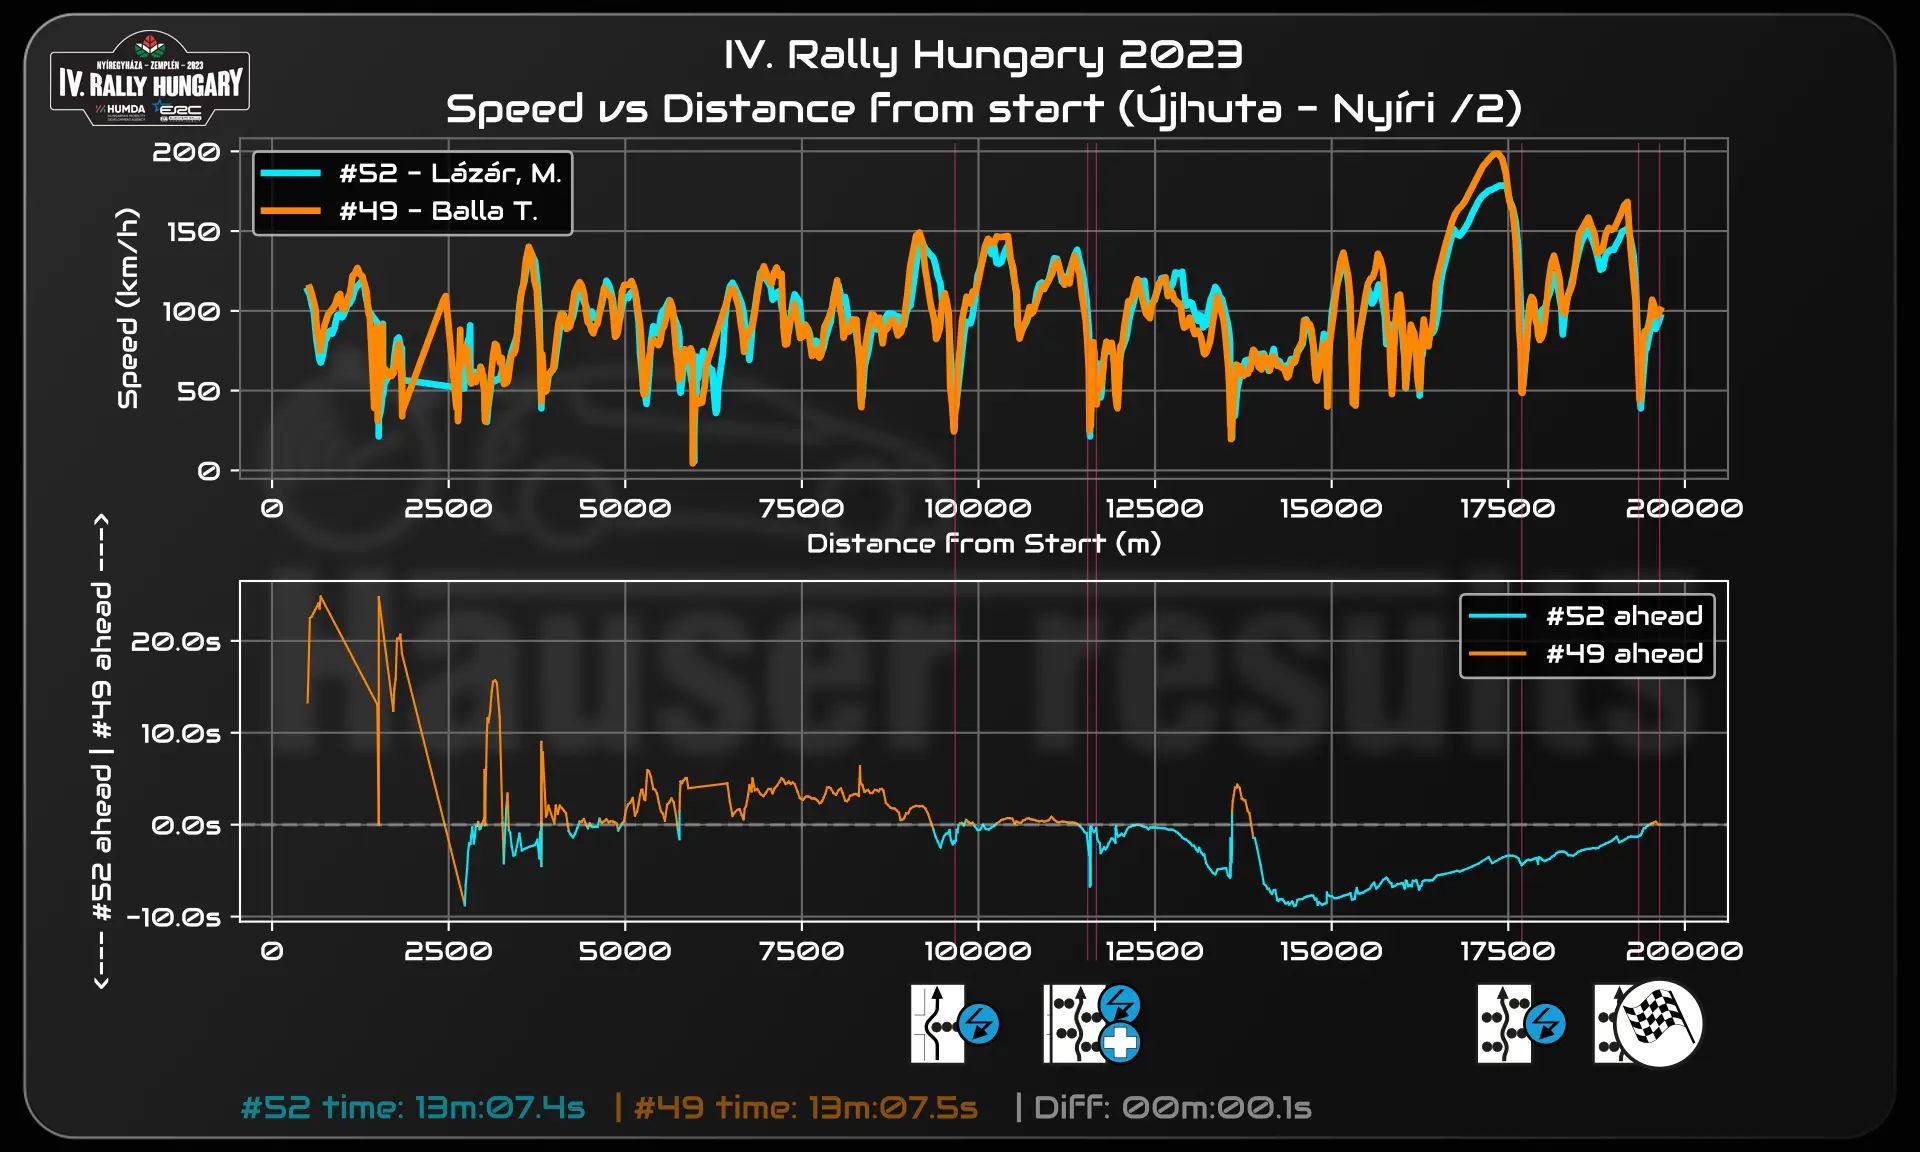
In this example we can see the speed of the competitors on a stage. On the bottom we can see the delta of the predicted time of the drivers, and showing who is leading the race. The red lines show some interesting points on the stage, like a chicane or a hairpin.
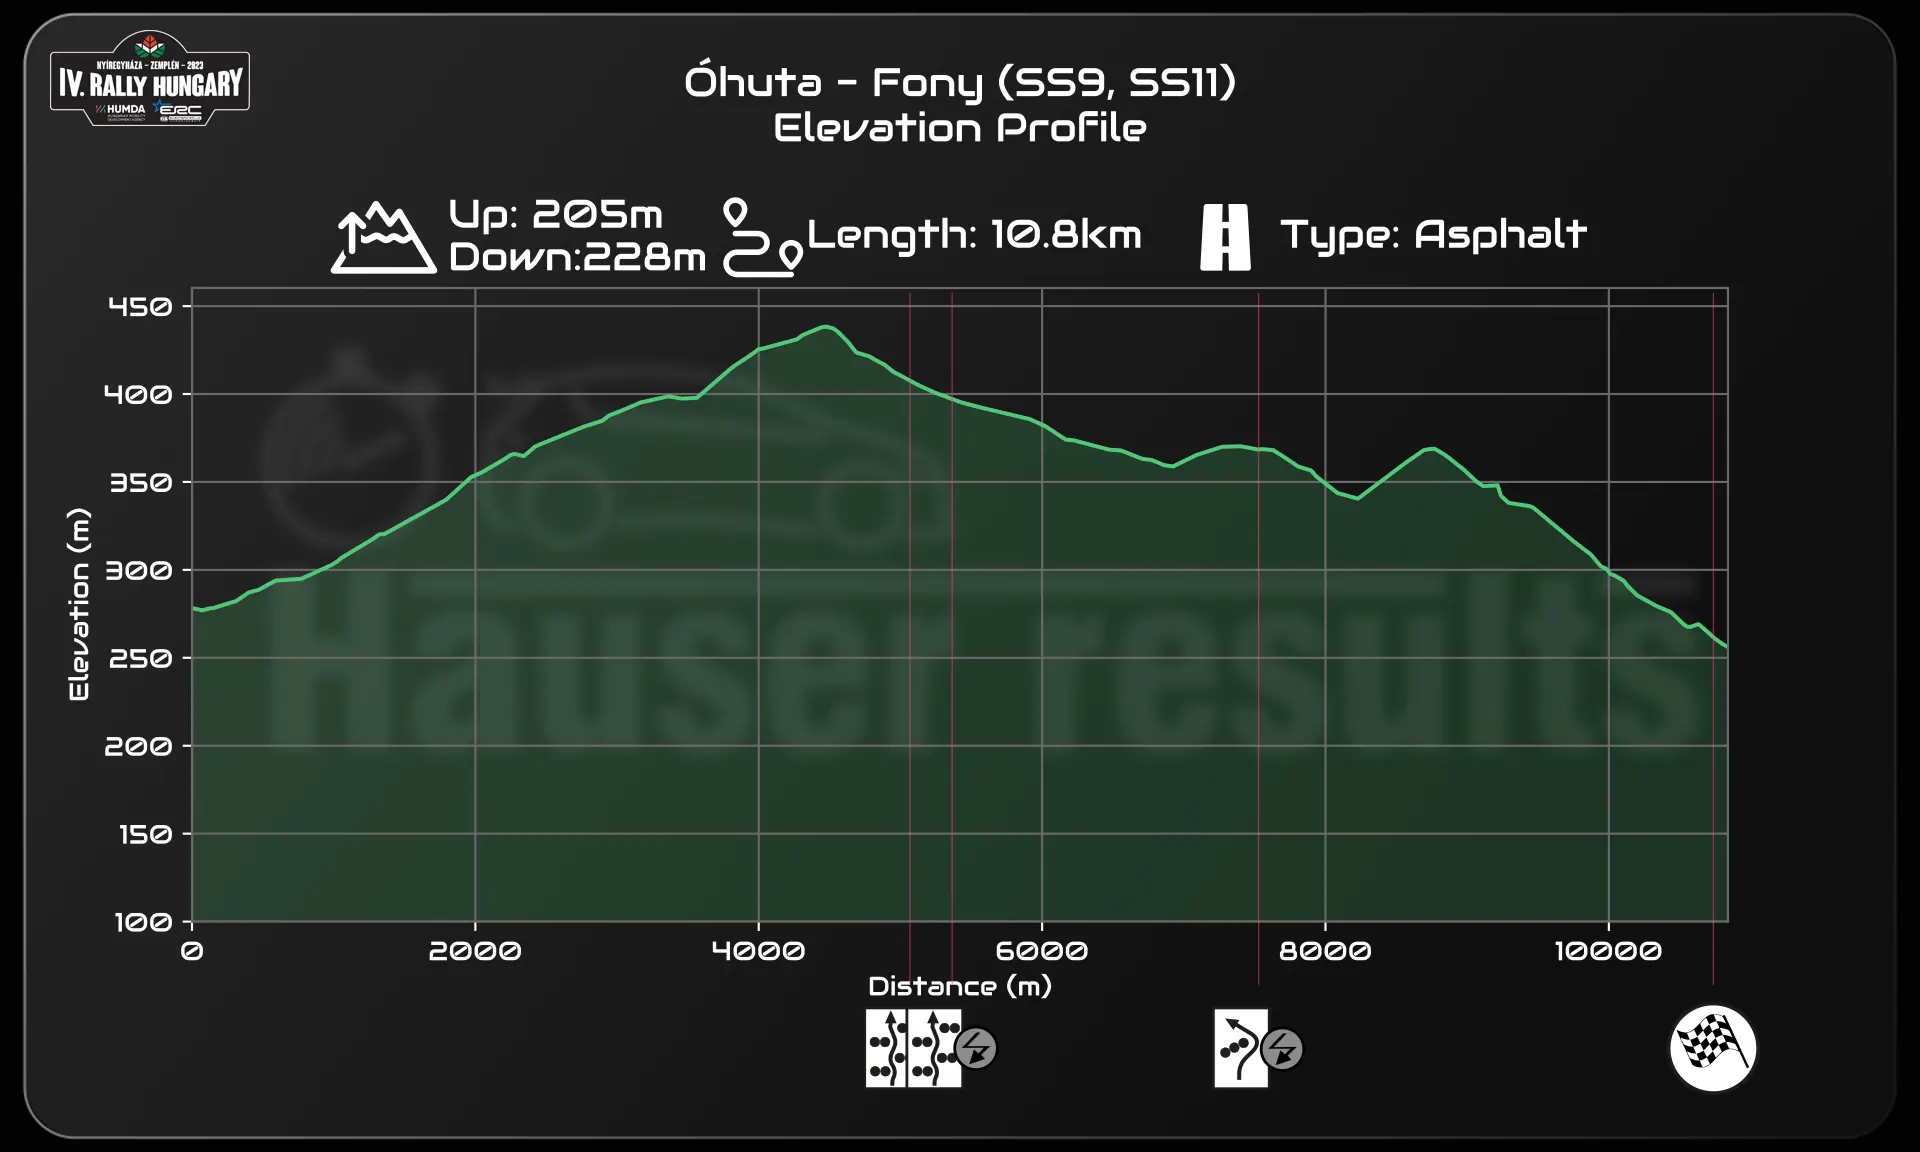 This example shows the elevation profile of a track with the interesting points.